
See How You Stack Up: Competitive Insights from Zero-Party Ads
When you run an ad campaign, you learn how many people saw the ads, finished your video, or whether they clicked to learn more. Helpful? Sure. But these metrics only scratch the surface.
What if your ads could reveal something deeper—how people feel in the moment after seeing your message? Not just how they perceive your brand, but how they compare you to your competition?
Our platform lets advertisers embed dynamic, in-ad survey questions to gauge real-time sentiment and brand perception. One of the most powerful tools in our Audience Insights reporting suite is the Sankey Chart—a visualization that shows how sentiment and preferences flow from one question to the next.
By pairing a brand sentiment question with a competitor question, advertisers gain a richer, side-by-side look at how they’re positioned in the minds of real viewers.
Here are two examples of how brands are using ViralGains Sankey Charts to uncover audience insights as it relates to competition:
Athletic Shoe & Apparel Brand
A leading running gear brand wanted to understand how its video ads influenced consumer consideration—and how it compared to key competitors. They used Zero-Party ads to ask two simple but powerful questions:
- Q1: How likely are you to purchase [Brand Name] the next time you shop for running footwear or apparel?
- Q2: Which of the following brands comes to mind first when thinking about running footwear or apparel?
Here were the results:
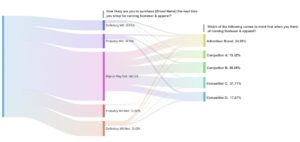
Key Insights:
- Nearly 50% of viewers were undecided, indicating an opportunity for re-engagement with benefit-driven messaging to boost consideration.
- The advertiser brand led in top-of-mind awareness with 25% selecting it first—but competitors B and C were close behind, signaling a tight race.
- Interestingly, 22% of those likely to purchase the brand named competitor D as their top-of-mind choice—suggesting this competitor may be winning favor among high-intent consumers.
Pharma Brand:
A leading pharma brand wanted to understand how consumers felt about their current chronic migraine treatment—and how that sentiment aligned with usage of their brand versus key competitors. They asked two in-ad questions:
- Q1: Are you satisfied with your current chronic migraine treatment?
- Q2: Do you currently use any of the following medications?
Here were the results:
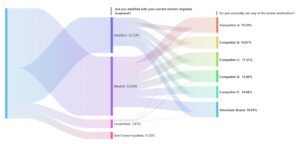
Key Insights:
- 53% of respondents reported feeling neutral about their current treatment—highlighting a major opportunity to educate and engage patients who may be open to switching.
- The advertiser’s brand and Competitor A were the most frequently used medications. However, both had high usage among patients who felt neutral, suggesting many users are on the fence about their current experience.
- Competitors B and C stood out, with a stronger share of usage among satisfied patients (44% and 36%, respectively) and little to no usage among unsatisfied ones—potentially signaling higher perceived effectiveness.
Whether you’re trying to win over undecided shoppers or retain high-intent customers, understanding how your audience perceives you—and your competitors—is critical. Sankey Charts turn that understanding into action, helping you uncover new opportunities, refine messaging, and outmaneuver the competition—straight from the source that matters most: your audience.